Table of Contents
The Orx Profiler
Every application that is built using Orx contains a profiler tool. The Profiler is compiled-in when using either debug or profile modes.

The tool helps you diagnose bottlenecks and monitor performance and internal resources.
To show the profiler in your game or application, add the following to your config:
[Render]
ShowProfiler = true
Although it makes more practical sense to toggle it on and off with a key stroke:
[Input]
SetList = InputSetTemplate

[InputSetTemplate]
KEY_TAB = ToggleProfiler
  if(orxInput_HasBeenActivated("ToggleProfiler"))
  {
    /* Toggles profiler rendering */
    orxConfig_PushSection(orxRENDER_KZ_CONFIG_SECTION);
    orxConfig_SetBool(orxRENDER_KZ_CONFIG_SHOW_PROFILER, !orxConfig_GetBool(orxRENDER_KZ_CONFIG_SHOW_PROFILER));
    orxConfig_PopSection();
  }
Run your application again, and press the Tab key to bring up your Profiler.
Profiler Layout

1) Thread Frame bar
This grey bar indicates which thread is currently selected. Most of Orx's tasks run on the main thread. There are other threads that handle things like streaming audio, resource requests and bitmap decompression. Select your thread with the Page Up and Page Down keys.

The first value displayed is the amount of time in ms that it took to render the entire current frame. The second value shows the largest amount of time that a frame took to render in the last second.
2) The Meter Bar Panel
These colored meter bars indicate how much time each Marker took to complete within the frame. The colors themselves correspond to the colors on each Marker in the Marker Panel.
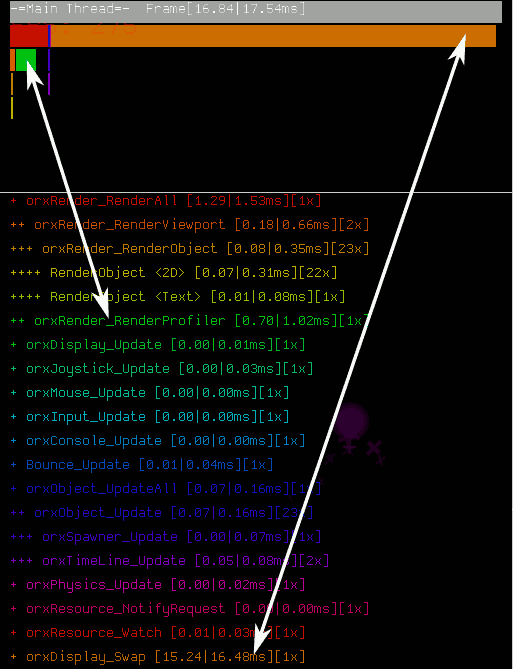
The bars are spread over four or more lines. The row of the bar corresponds to the level of the function call marker. For example, the orxRender_RenderAll function call is on the top level, so sits in the top row. The orxRender_RenderObject function call is three levels into the hierarchy and is therefore on the third row.

This helps easily distinguish between the markers that are of similar color.
3) Marker Panel
This panel shows all the Markers currently running in the frame. Markers represent important function calls. Each Marker contains three numbers.

The first is the amount of time in ms this Marker has taken to run in the current frame. The second number indicates the longest amount of time this Marker took to run in the last second.
The last number shows how many times this Marker was run in the frame.
You can even add your own custom markers.
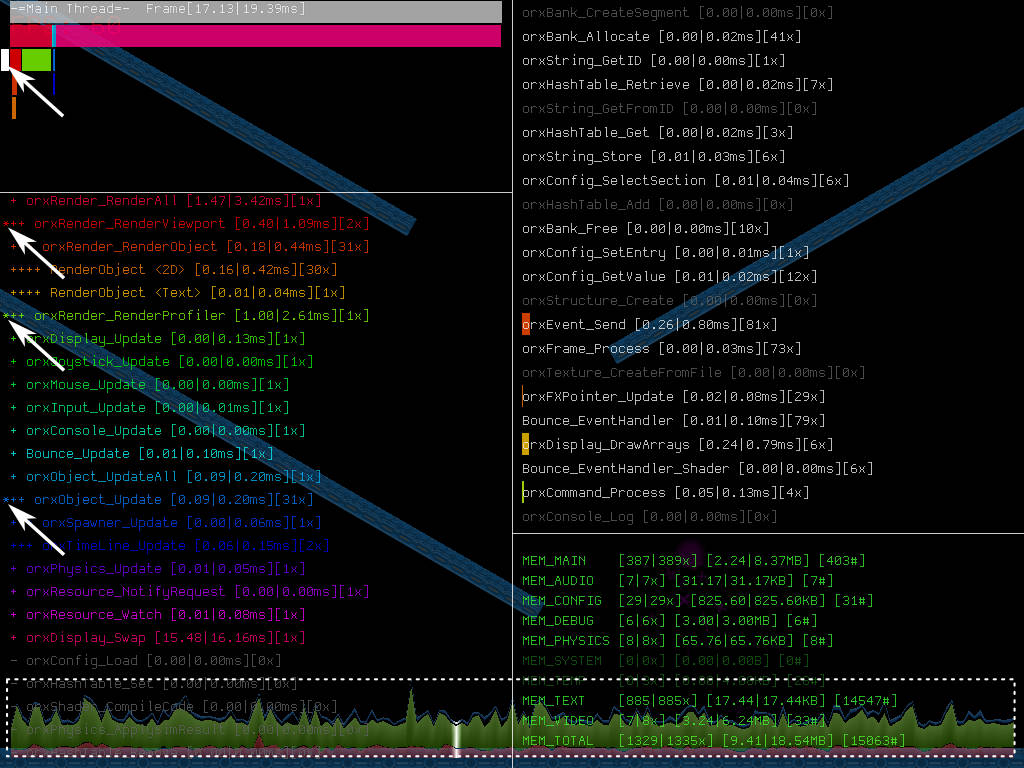
The grey markers indicate functions that were called at some point - but not during the frame. So they will show having run 0x times.
4) Secondary Marker Panel
The Markers in this panel are white and have more than one parent. Therefore they don't fit in to the tree hierarchy.

These markers can be grey in this panel as well for the same reason as the Marker Panel above.
5) Memory Panel
Each line represents a different type of memory.

The first group of numbers represents the number of live allocations and the second number is the max allocations in the past.
The second group of numbers is the same, but is now representing the size of the memory allocations.
The last number shows the amount of transactions since the beginning of the application. A transaction is the allocating or de-allocating of memory.
In the demo playground application, the memory will not change much. Orx is very conservative with memory allocations. You can observe this by spawning many objects with the left mouse button.
Using the profiler
You can pause or unpause the profiler at any time by pressing F5.
Observe the running function call Markers. When first running the profile on the playground application, there will be no physics calls running in the engine. You can still interact with the demo in the background. If you click with the left mouse button you will spawn some physics objects.
Notice that the orxPhysics_ApplySimResult marker now appears in the Marker Panel. And there is a corresponding colored meter bar for it in the Meter Bar Panel. Once all the objects have finished their lifetime and have disappeared, then the orxPhysics_ApplySimResult marker drops down to grey again and is no longer called.
You can profile an application with vsync on or off. In the playground application you can toggle this with the `F11` key. With vsync on, the longest bar will be the orxDisplay_Swap marker. This is not Orx working hard on a task, but rather the driver wait time for the next vertical sync.
If you spawn lots of objects you can see the time taken on the orxPhysics_Update marker increases and the orxDisplay_Swap marker decreases, as there is less time waiting, and more time updating the physics on the objects.
History Graph
You can activate a history graph of frames by pressing F8 key. You will see past frames. The colors on each vertical slice correspond to the Meter Bars.

You can pause this graph with F5 and you can scroll back and forth (using the Left and Right keys) through the history to a particular frame to inspect the meters and values for each Marker to observe spikes.
The white vertical line shows the current frame being inspected.
You can get more details on a particular marker depth by using the Up and Down keys. Notice a white indicator in the Meter Bar Panel that moves up and down to the selected depth?
And that is the Orx Profiler. This tool should be invaluable for checking the health of your application and to help you optimize it.
Choosing the Profile Orientation
The Profiler orientation can be set as either portrait or landscape. Landscape is the default. You can see the ShowProfiler and ProfilerOrientation properties available for the Profiler in the Render Config Properties:
[Render]
ShowFPS = <bool>
ShowProfiler = <bool>
ProfilerOrientation = portrait | landscape
ConsoleBackgroundColor = <vector>
ConsoleBackgroundAlpha = <float>
ConsoleSeparatorColor = <vector>
ConsoleSeparatorAlpha = <float>
ConsoleLogColor = <vector>
ConsoleLogAlpha = <float>
ConsoleInputColor = <vector>
ConsoleInputAlpha = <float>
ConsoleCompletionColor = <vector>
ConsoleCompletionAlpha = <float>
ConsoleFontScale = <float>
You can set to portrait with:
[Render]
ProfilerOrientation = portrait

This rotates the profiler to the left, perfect for portrait monitors.
